Digital maps are complicated. But they’re not just regular complicated–I like to say they’re fractally complicated. As in, every interesting problem is actually composed of several other interesting problems. That’s what makes them so much fun to work on!
The past few months’ set of interesting problems has been labels. They are rather important on a map. Compare:
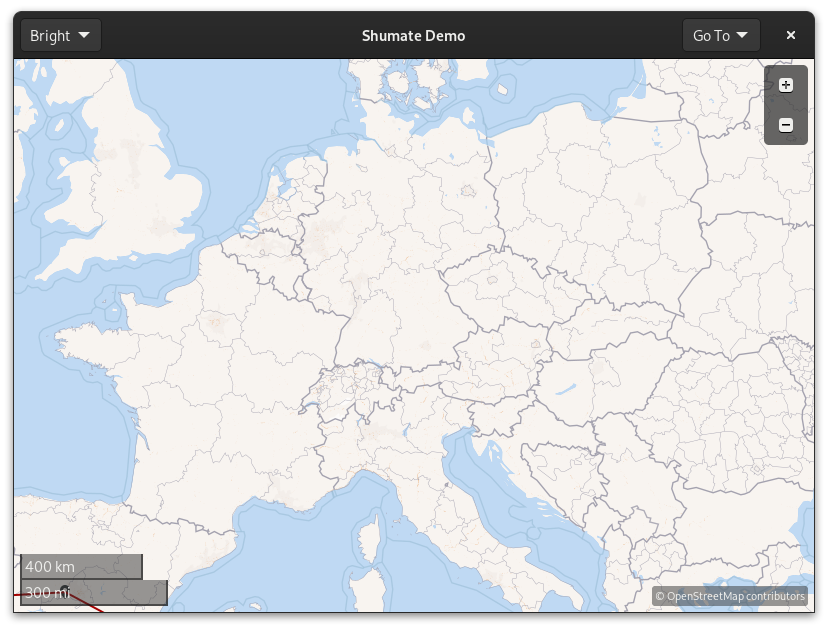
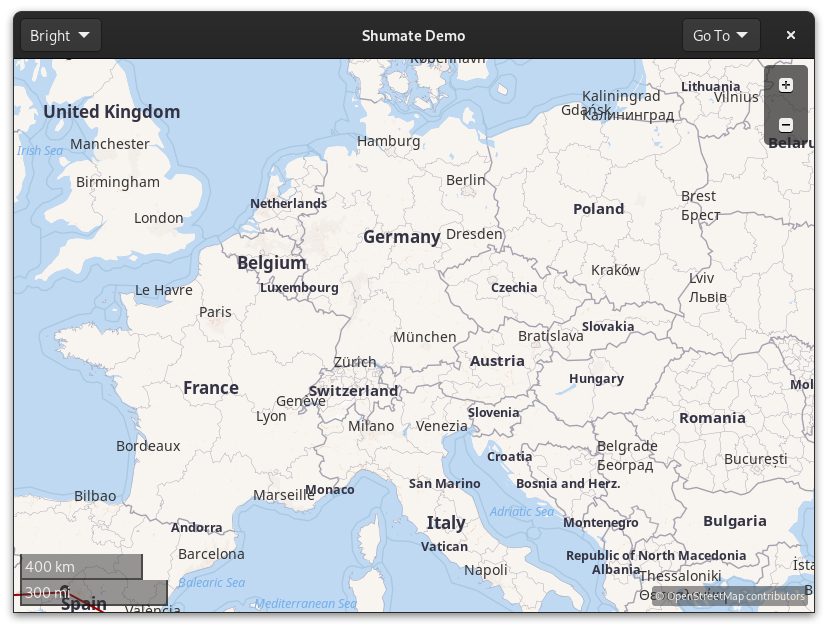
Place labels
The first step was to get labels to appear at all. That was fairly straightforward, as it just required reading from the vector data and creating a GtkLabel. It looked like this:
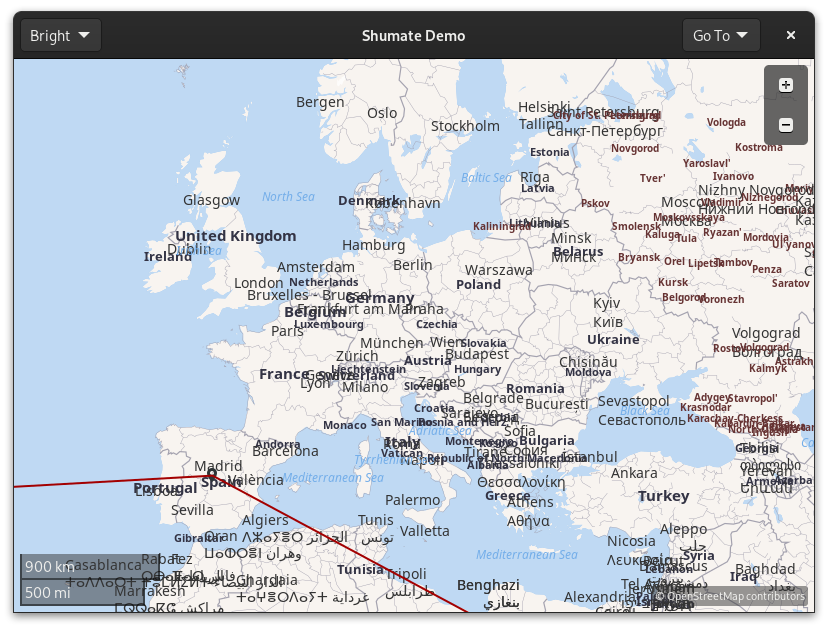
Yikes. The labels are all on top of each other, and it’s hard to read them. We need a way to hide some of the labels so that none of them overlap. There are several approaches that could be taken here, but I decided to go with one of the simpler ones: an R-tree.
Work smarter, not harder
The easiest way to solve this problem is to check whether each label overlaps each other label. Unfortunately, this algorithm would be far too slow–it’s O(n2) because it uses two nested loops over the input. As the input grows linearly, the amount of time required grows quadratically. Now, sometimes, that’s fine: if your input is always small, or if CPU time isn’t a concern, it’s not an issue. But here, we might have a thousand labels on the screen, and the overlap needs to be recalculated every frame when you’re zooming or rotating. So quadratic is not going to cut it.
Enter R-trees. Trees are extremely important in computer science because they allow us to store data recursively and use divide-and-conquer algorithms on it. In libshumate, the R-tree stores labels in nodes based on their location. Each node has a bounding box that surrounds all the nodes inside it. That enables an extremely effective optimization: if two nodes don’t intersect, none of their children can possibly intersect with each other.
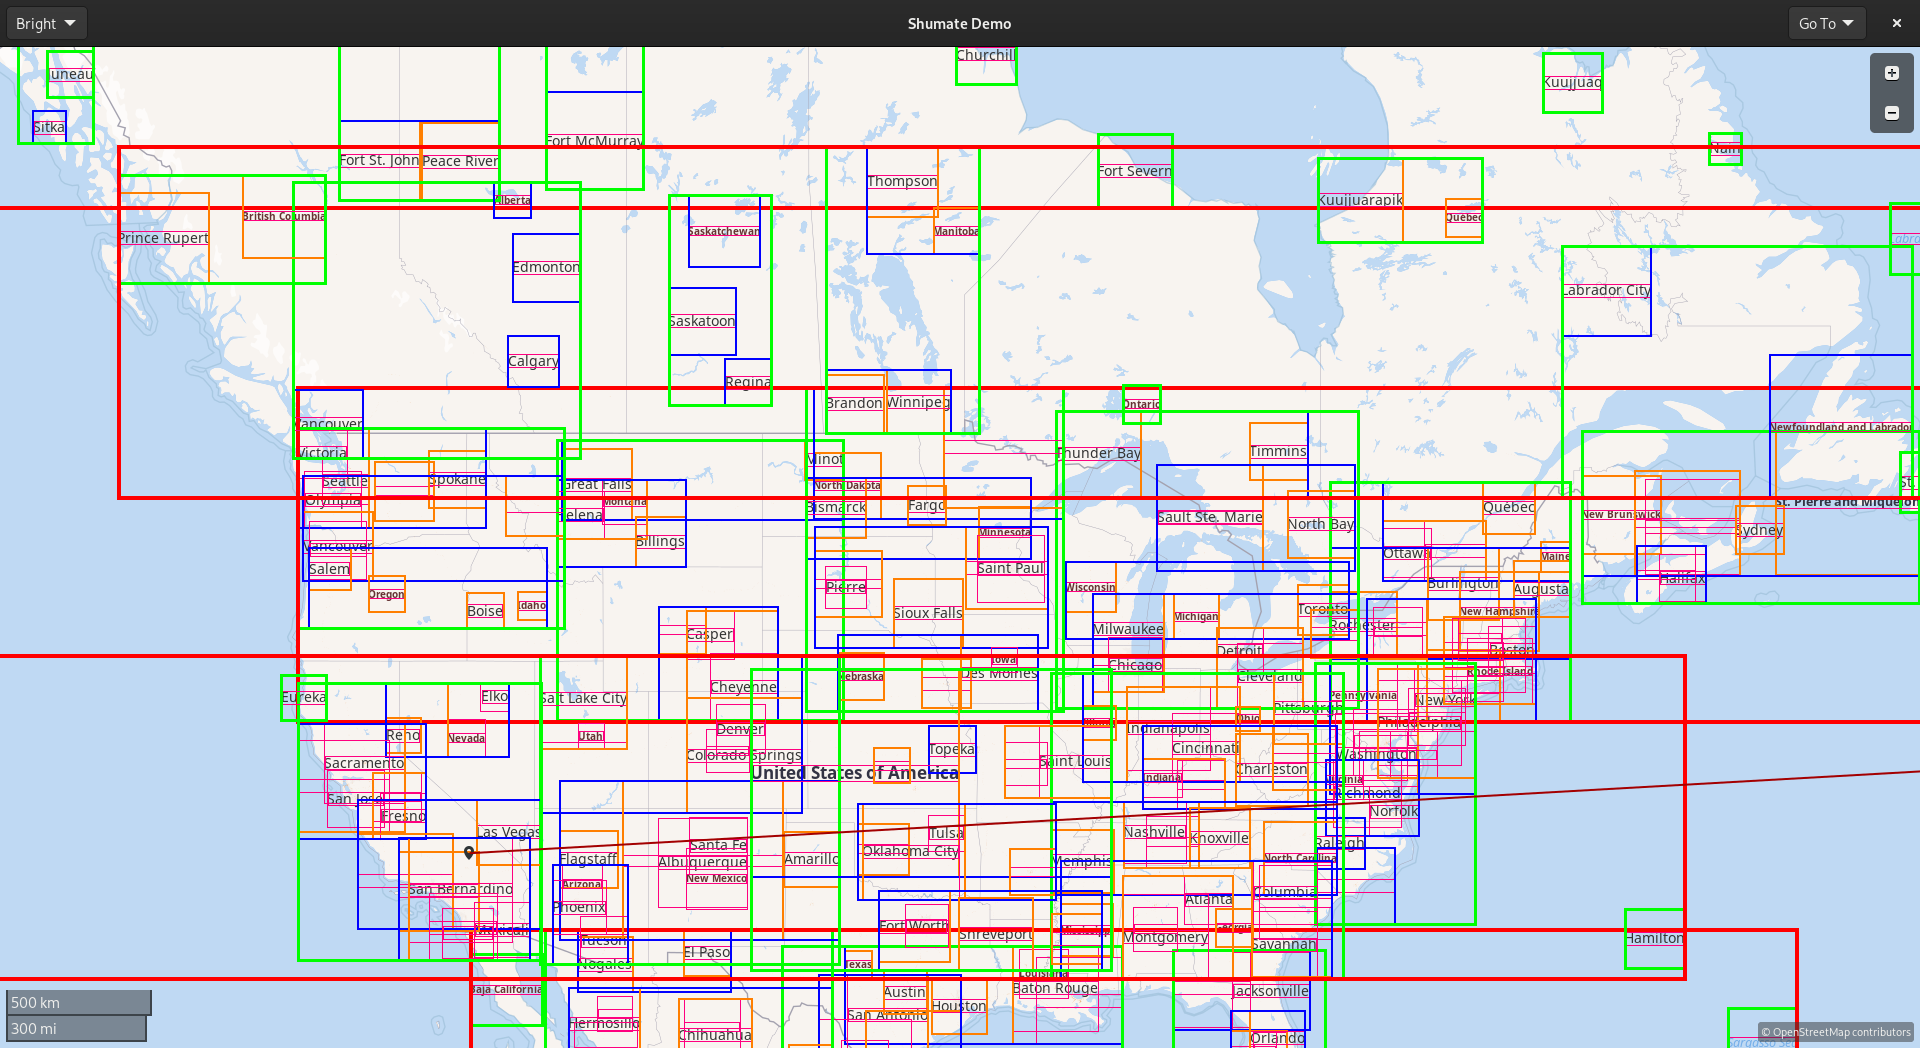
Above is a visualization of libshumate’s R-tree. Note how nearby labels are grouped together into orange nodes, then blue nodes, then green, then red. When searching for overlap, we can start with the red nodes. If the label in question doesn’t intersect a given red node, we don’t have to search any of its children. If it does intersect, we search the green nodes similarly, then blue, etc. If a label intersects with one that’s already been placed, we hide it for that frame.
Line labels
The next step was “line labels”–labels that follow a line geometry such as a river or a street. These were tricky for a whole different reason: text rendering.
The GNOME platform’s text rendering library is called Pango. It handles all the
complicated parts of converting a char * into pixels. There’s a general
overview of the steps of this process in the Pango docs
if you’re interested in learning more.
There are many different “units” of text–bytes, characters, code points, and glyphs–all of which can be different! For example, the 🇺🇸 United States Flag emoji consists of two Unicode code points in sequence: 🇺 Regional Indicator Symbol Letter U and 🇸 Regional Indicator Symbol Letter S. And in the UTF-8 encoding, those code points take four bytes each.
What libshumate is interested in is glyphs. A glyph is a visual unit of text– a single image that appears on screen. Libshumate uses Pango to convert a string of text into glyphs using the given font, then interpolates along the line geometry to place each glyph individually. The initial result looks like this:
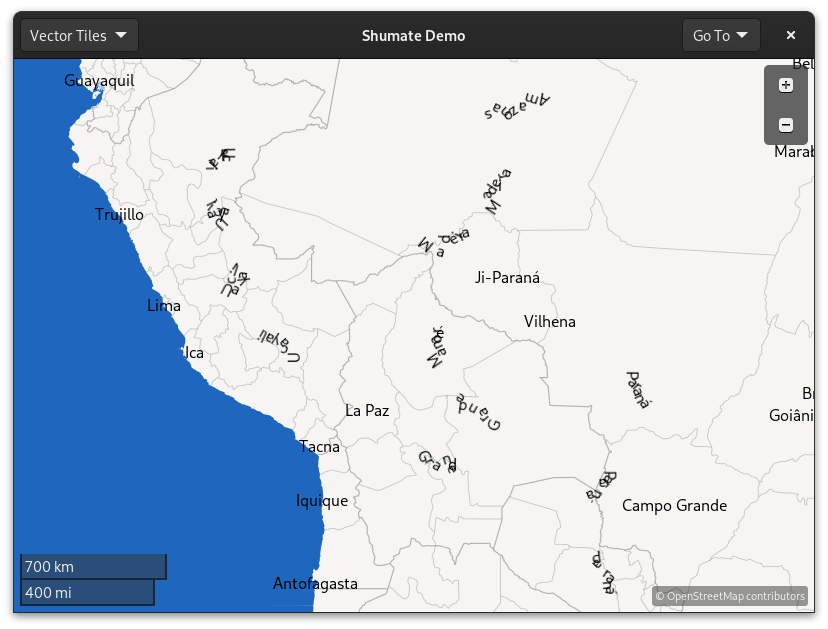
Yikes again! The river geometry is extremely detailed. This is great for drawing the river itself, but it causes the glyphs to be drawn all jumbled.
I tried several line simplification algorithms to try to fix the problem. One popular algorithm is called the Visvalingam-Whyatt algorithm, which deletes points along a line based on the area of the triangles they form with neighboring points. The idea is to delete points that “don’t matter much” to the overall shape of the line. However, this technique didn’t work very well because it left many sharp angles, which still confuse the glyph placement. The next technique was to average each point with its neighbors, “smudging” the line smooth. This worked too well, and deformed street labels even if they looked fine!
In the end, I went with an algorithm that merges neighboring points if they are too close to each other. This did the best job of solving the original problem– too much detail–so the result looks like this:
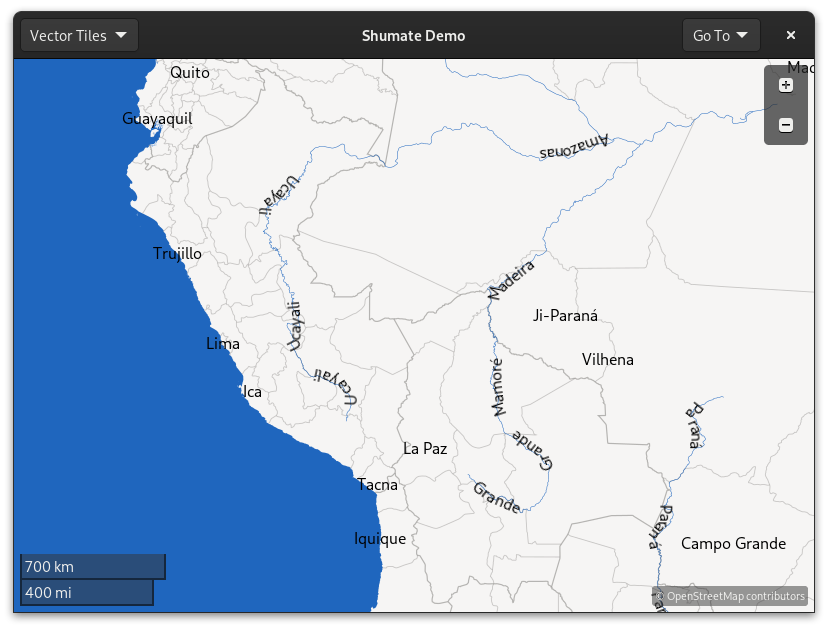
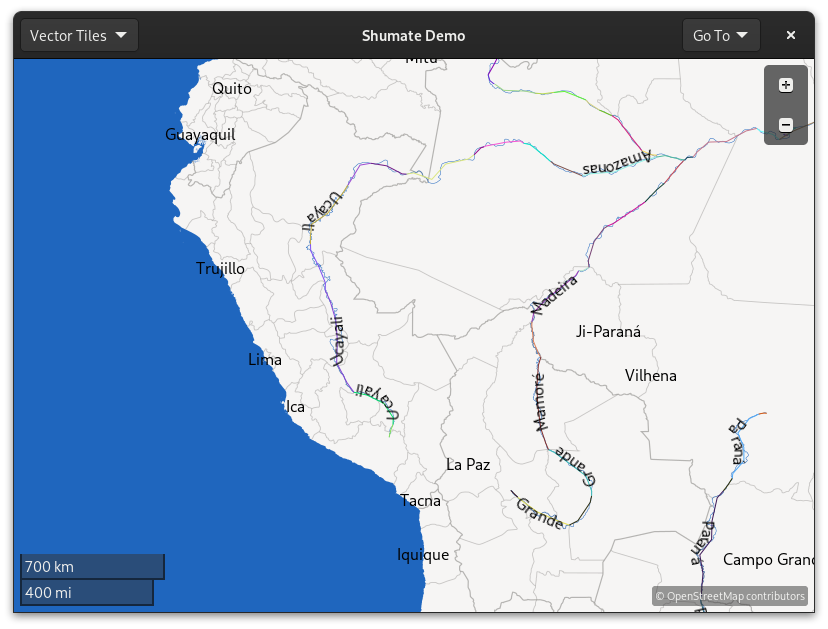
Much better! You can see in this visualization that the lines used to draw labels skip over the high-detail twists and turns of the original geometry:
Future Work
One of the most interesting things we can do with these labels is make them directly clickable. Right now, in GNOME Maps, you have to right click and choose “What’s Here?” to get information about a place, but with labels as widgets, you’ll be able to click on them directly like on other maps. This will have to wait for the GTK4/libshumate port of Maps, of course, but this work makes it possible.
Also, labels need icons! They’re important for recognizing different types of places and for highway shields. I’ve already started working on them, and hopefully it won’t take four months this time!

